
Graphical Statistics - Dashboard Widgets
Antivirus scan
Powered by ClamAV
✅ Verified clean
This product file has passed our security filters.
Want to run a fresh ClamAV scan right now? Takes a few seconds and shows scanner version, signature DB and live result.
This can take 5 to 30 seconds.
Clean file Threat detected
No threats detected in this file.
- File
- Size
- Scanned
- ClamAV
- Signature database
⚡ Powered by ClamAV
Scan could not be completed
Report product
If you detected an issue (broken file, malware, inappropriate content, etc.) let us know and we'll review it ASAP.
Sign in to report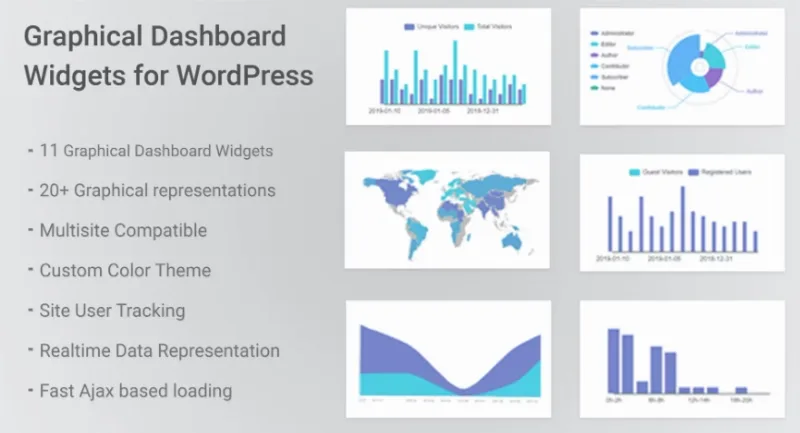
About Graphical Statistics - Dashboard Widgets
Opening the WordPress dashboard and not knowing what is going on
You log in and see a handful of notices, last week's draft and little else. To find out how many visits you had, which browser they used or how many comments are waiting for moderation, you have to jump between screens. Graphical Statistics - Dashboard Widgets brings all of that together as charts inside the dashboard itself, so a quick glance when you log in is enough.
What makes it interesting is that it mixes two kinds of data that rarely live together: traffic (visits, browsers, countries) and the internal state of the site (posts, pages, comments, users). Site owners usually watch the first and forget the second, until hundreds of drafts or unreviewed spam pile up.
Which charts appear on your dashboard
The plugin adds 11 widgets, each with one or more charts. They load via AJAX, so they don't slow down the dashboard, and you can choose the chart colors so they match your theme.
Traffic and audience
- Visitors in the last 15 days: compares unique visitors with total visits, useful to tell new audience from returning audience.
- Users in the last 15 days: separates visits by guests and by registered users.
- Browsers and platforms: two charts each, one with the total and one with the daily detail. They group Chrome, Firefox, Safari, Opera, Internet Explorer and others; and Apple, Windows, Linux, Android and others.
- Visits by country: the last 30 days.
- Today's visits and online users: split into two-hour blocks and who is connected right now.
Content and community
- Page count: donut chart by status (published, draft, pending, private).
- Post statistics: posts by month and year, total per year and breakdown by status.
- Comments: approved, spam, trash, pending.
- Categories: the most used and the least used by number of posts.
- Users: sign-ups by month and year, yearly total and breakdown by role.
Who gets value from it and who doesn't
Blogs and magazines with several authors
The charts for posts per month, categories with the most and least content and draft status show your publishing rhythm and which topics are being neglected.
Sites with registration or a community
Sign-ups per month and the breakdown by role show whether the community is growing and how many administrators or editors there really are.
Agencies handing a site over to a client
A client who doesn't want to open another analytics tool can see a donut chart on their dashboard instead of a technical report.
A short window, no long comparisons
The traffic charts look at the last 15 or 30 days and today's visits. If you need to compare one year with another, measure conversions, see traffic sources or analyze each visitor's journey, this does not replace a full analytics tool. It is a quick control panel, not a report.
Frequently asked questions
Does it show real-time data?
The charts load via AJAX with the site's current data, and there is a widget showing online users.
Does it slow down the dashboard?
It is designed to load the charts quickly without affecting site speed.
Can I adapt the colors?
Yes, you can choose the chart colors so they fit your theme.
Can I see where visits come from?
It shows visitors' country for the last 30 days, plus browser and platform. It does not describe traffic sources such as search engines or social networks.
Is there a demo to try it?
Yes, there is a live demo with username and password demo, so you can see the charts before deciding.
Topics
Version history
-
v
1.7.1 Current 25 Aug 2026
-
v
1.6 15 May 2024
Customer reviews
Sign in to leave a review. Only people who have the product can review it.
No reviews for this product yet.
Frequently asked questions
-
GPL (General Public License) is the license under which WordPress and most premium plugins/themes are distributed. It grants you the right to use, modify and redistribute the software in as many projects as you want, with no domain restrictions.
-
Yes. With membership you get automatic updates via our GPLClub Updater plugin (installed on your WP, detects new versions and applies them). With individual purchase, you get one year of manual updates from your account.
-
Depends on the plan. Monthly: 3 domains. Semi-annual: 7. Annual and Lifetime: 15. Individual purchase: 1 domain.
-
GPLClub offers its own support for installation, configuration and compatibility. For direct support from the original author (feature requests, product-specific bugs), a license purchased from the author is required.