Graphist – Graphs & Charts for Elementor
Antivirus scan
Powered by ClamAV
✅ Verified clean
This product file has passed our security filters.
Want to run a fresh ClamAV scan right now? Takes a few seconds and shows scanner version, signature DB and live result.
This can take 5 to 30 seconds.
Clean file Threat detected
No threats detected in this file.
- File
- Size
- Scanned
- ClamAV
- Signature database
⚡ Powered by ClamAV
Scan could not be completed
Report product
If you detected an issue (broken file, malware, inappropriate content, etc.) let us know and we'll review it ASAP.
Sign in to report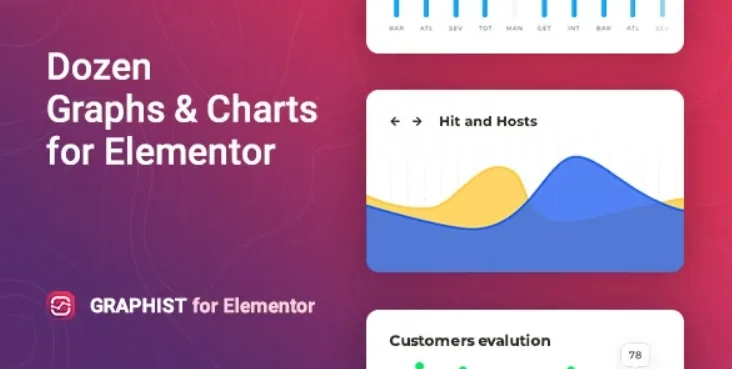
About Graphist – Graphs & Charts for Elementor
A table of figures doesn't get read, a chart does
You have a report, some statistics or quarterly results, and you end up pasting an Excel screenshot as an image: it doesn't adapt to mobile, it can't be edited and it is out of date as soon as a figure changes. Graphist solves that inside Elementor: your figures become charts that are widgets, not images.
People who install it usually run a business that reports results with numbers (a consultancy, a non-profit, an agency showing metrics to its clients) and rarely have time to redesign every report. A chart edited on the same page where it is published stays up to date, while one that lives in an image stays frozen and ends up showing old data that looks official.
How to build an annual report with Graphist
Imagine you need to publish the year's visit trend and the breakdown by acquisition channel.
Step 1: choose the chart type
When you activate the plugin, 12 new widgets appear in Elementor: line, bar, pie, donut, gauge, dots, bi-polar line, bi-polar bar, multiline bar, stacked bar, area and holes.
Step 2: enter the data
From the widget panel you add as much data as you need. Here is the limit to keep in mind: you enter it yourself inside Elementor. If your figures change every day, check in the demo whether that manual workflow is worth it for you.
Step 3: match it to your site's style
You can change colors, fonts, borders, margins, paddings, animation and the grid, all from the Elementor interface and without writing code. The chart scale sets an optimal step on its own. Line and area charts have extra settings, such as the color of the grid lines, and in line charts you can show or hide the points. Recent versions add titles for the axes.
Step 4: check how it looks on each device
There are responsive settings to adapt the chart to small screens. It works with the usual browsers (Chrome, Firefox, Safari, Opera and Edge), supports right-to-left languages and includes a pot file for translating the texts.
Questions to ask before building your first chart
Does it work without Elementor?
No. Graphist is a set of widgets for Elementor.
Do I need to know how to code?
No. Data and style are configured from the Elementor panel.
Does it work with any theme?
It works well with themes built on Elementor. If you use another kind of theme, try it in the demo first.
Can I have it in my language?
It includes a pot file so you can translate it.
Graphist draws data you already have, it doesn't collect it
It is built on the Chartist.js library, designed for flexible and adaptable charts. Its job is to present well the figures you provide. It's worth being clear on this so you don't expect something else:
- It isn't an analytics tool: it doesn't measure your traffic or generate reports on its own.
- It doesn't replace a dashboard with real-time data.
- It is a good option for reports, statistics and results that you want to publish with a polished look that is easy to edit.
Version history
-
v
1.2.7 Current 8 Jan 2025
Customer reviews
Sign in to leave a review. Only people who have the product can review it.
No reviews for this product yet.
Frequently asked questions
-
GPL (General Public License) is the license under which WordPress and most premium plugins/themes are distributed. It grants you the right to use, modify and redistribute the software in as many projects as you want, with no domain restrictions.
-
Yes. With membership you get automatic updates via our GPLClub Updater plugin (installed on your WP, detects new versions and applies them). With individual purchase, you get one year of manual updates from your account.
-
Depends on the plan. Monthly: 3 domains. Semi-annual: 7. Annual and Lifetime: 15. Individual purchase: 1 domain.
-
GPLClub offers its own support for installation, configuration and compatibility. For direct support from the original author (feature requests, product-specific bugs), a license purchased from the author is required.