MapSVG Interactive Maps Plugin
Antivirus scan
Powered by ClamAV
✅ Verified clean
This product file has passed our security filters.
Want to run a fresh ClamAV scan right now? Takes a few seconds and shows scanner version, signature DB and live result.
This can take 5 to 30 seconds.
Clean file Threat detected
No threats detected in this file.
- File
- Size
- Scanned
- ClamAV
- Signature database
⚡ Powered by ClamAV
Scan could not be completed
Report product
If you detected an issue (broken file, malware, inappropriate content, etc.) let us know and we'll review it ASAP.
Sign in to report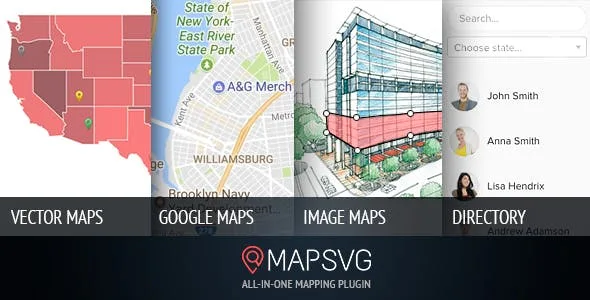
About MapSVG Interactive Maps Plugin
An interactive map is a database shaped like a territory
Whoever looks for a region map usually thinks about the drawing: the country split into provinces, the plan of a trade fair, the floor of a building with its units. The drawing gets sorted in an afternoon. What stays with you for years is the data: which distributor covers each area, which unit is free, which figure belongs to each region.
What decides the purchase of an interactive map plugin is not how many maps it includes, but where it reads the information from and who can keep it up to date. MapSVG is built on that idea: every region and every object on the map is a record with its own fields, and the map is the way to show them.
Three kinds of map in the same plugin
- SVG vector maps: more than 100 included, and you can upload your own SVG to turn its shapes into clickable regions.
- Google Maps, on its own or with SVG layers on top, with SnazzyMaps styles.
- JPEG or PNG images turned into maps by drawing the clickable areas on top, which is what works for floor plans.
Where the map data comes from
This is the difference from a pin map. Data can come from MapSVG's own database, WordPress posts, WooCommerce products, Advanced Custom Fields, Google Sheets or the JSON response of your own API.
In practice, the distributor map can read the sheet the sales team already updates, and the plan of a development, the products in the shop. The data gets changed where it already lives.
Everything else is built on top of that data: filters by field or by distance, text search, a directory next to the map and a detail window designed with Handlebars templates.
Colouring by figures and drilling down
Choropleth map: you give each region a numeric value and MapSVG turns it into a colour. It is the classic way to show sales by province, results by district or coverage by area.
Parent and child maps: a region on the main map links to a more detailed map, for example from the country to one of its provinces.
Where MapSVG falls short
It does not draw maps from scratch. It includes more than a hundred and accepts your own SVG files, but if the territory you need is not there, you have to find or commission the SVG yourself.
It loses smoothness with many markers. Beyond 1,000 or 2,000 markers performance drops and the page can slow down, and the way out is pagination or clustering. For a locator with thousands of points there are tools designed for that.
Requirements and first steps with MapSVG
WordPress 5.0 or higher, PHP 7.4 or higher and a modern browser. The map can be shown on a non WordPress site through an iframe, but it is still managed from a WordPress install. Using Google Maps requires your own Google API keys.
- Decide first where the data will come from: its own database, posts, products, ACF or a spreadsheet.
- Define the fields for each region or object before touching the design.
- Pick one of the included maps or upload your SVG.
- If you will go beyond a thousand markers, enable pagination or clustering from the start.
Other interactive maps in the catalogue
Interactive Geo Maps is the most direct competitor: it starts from more than 250 vector region maps and reads data from Google Sheets, JSON, posts and ACF.
If yours is more about points on a street map than regions, WP Maps Pro works with Google Maps or Leaflet, filters by categories or fields with radius search and imports locations by CSV.
Questions about MapSVG
Can I use a map that is not included?
Yes, by uploading your own SVG file: its shapes become clickable regions. What it does not do is create that SVG for you.
Does it work for a venue floor plan?
Yes. It turns a JPEG or PNG image into an interactive map, and the clickable areas are drawn on top.
How many markers can it handle?
Up to 1,000 or 2,000 it runs fine. Above that, pagination or marker clustering is advisable.
Can it read WooCommerce products?
Yes, WooCommerce products are one of its data sources.
Can it be customised with code?
Yes: it has a CSS editor, Handlebars templates, JavaScript events and its own API.
Version history
-
v
8.16.3 Current 17 Oct 2026
-
v
8.16.1 9 Sep 2026
-
v
8.16.0 5 Sep 2026
-
v
8.13.2 19 May 2026
-
v
8.12.2 9 Apr 2026
Customer reviews
Sign in to leave a review. Only people who have the product can review it.
No reviews for this product yet.
Frequently asked questions
-
GPL (General Public License) is the license under which WordPress and most premium plugins/themes are distributed. It grants you the right to use, modify and redistribute the software in as many projects as you want, with no domain restrictions.
-
Yes. With membership you get automatic updates via our GPLClub Updater plugin (installed on your WP, detects new versions and applies them). With individual purchase, you get one year of manual updates from your account.
-
Depends on the plan. Monthly: 3 domains. Semi-annual: 7. Annual and Lifetime: 15. Individual purchase: 1 domain.
-
GPLClub offers its own support for installation, configuration and compatibility. For direct support from the original author (feature requests, product-specific bugs), a license purchased from the author is required.